Contour Demo
Contour Demo
Source: contour_demo.f90
Comprehensive contour plotting examples: line contours, filled contours, custom levels, colormaps.
Files
contour_demo.f90- Source code- Generated media in
output/example/fortran/contour_demo/
Running
make example ARGS="contour_demo"
Output
Contour Filled
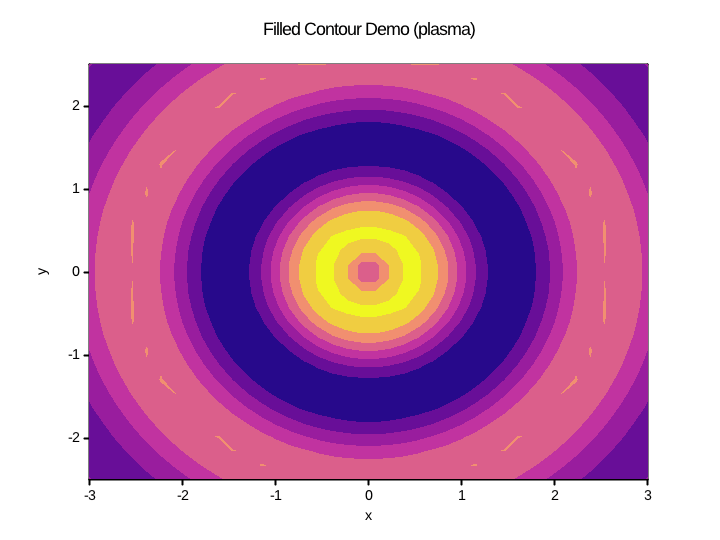
ASCII output:
                          Filled Contour Demo (plasma)
+--------------------------------------------------------------------------------+
|                                                                                |
| 2:::::::::-----====##########***#############***##########====-----::::::::::- |
| *:::::::------====#########################################====------::::::::: |
| *:::::----====#############====---------------====#############====----::::::: |
| *:::----===##########===----:::::::.......:::::::----===##########===----::::: |
| *----===#########====--::::.......................::::--====#########===----:: |
| 1--===#########==----::...............................::----==#########===---- |
| *-===########==--:::.....................................:::--==########===--- |
| *==########===-:::..........::::-------------::::..........:::-===########==-- |
| *==#######==--::..........::--==####*****####==--::..........::--==#######==== |
| *=########==-::.........::-=##**@@@@@@@@@@@@@**##=-::.........::-==########=== |
| 0########==--::........::-=##*@@@@@@@###@@@@@@@*##=-::........::--==########== |
| *########==--::........:--=#**@@@@@**###**@@@@@**#=--:........::--==########== |
| *########==--::........::-=##*@@@@@@@###@@@@@@@*##=-::........::--==########== |
| *=########==-::.........::-=##**@@@@@@@@@@@@@**##=-::.........::-==########=== |
| *==#######==--::..........::--==####*****####==--::..........::--==#######==== |
| -1=########===-:::..........::::-------------::::..........:::-===########==-- |
| *-===########==--:::.....................................:::--==########===--- |
| *--===#########==----::...............................::----==#########===---- |
| *----===#########====--::::.......................::::--====#########===----:: |
| *:::----===##########===----:::::::.......:::::::----===##########===----::::: |
| -2::::----====#############====---------------====#############====----::::::: |
| *::*::*--*--*==*##*##*##*##*##*##*##*###*##*##*##*##*##*##*##*==*--*--*::*:::* |
|-3          -2            -1           0            1             2           3 |
+--------------------------------------------------------------------------------+
                                       x
y
Contour Gaussian
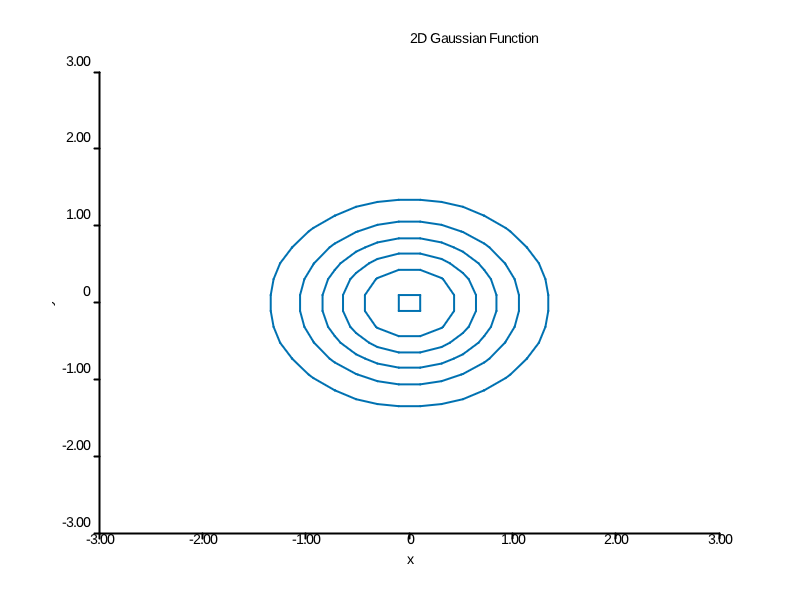
ASCII output:
                              2D Gaussian Function
+--------------------------------------------------------------------------------+
| 3                                                                              |
| *                                                                              |
| *                                                                              |
| 2                                                                              |
| *                                                                              |
| *                                                                              |
| *                                                                              |
| 1                               -------------                                  |
| *                         ------ ----------- ------                            |
| *                      -------------------------------                         |
| *                    --- --------------------------- ---                       |
| 0                   --  -- ----------------------- --  --                      |
| *                   -   -  - - -  -       -  - - -  -   -                      |
| *                   --  -- ----------------------- --  --                      |
| *                    --- --------------------------- ---                       |
| -1                     -------------------------------                         |
| *                         ------ ----------- ------                            |
| *                               -------------                                  |
| *                                                                              |
| -2                                                                             |
| *                                                                              |
| *                                                                              |
| *  *  *  *  *  *  *  *  *  *  *  *  *   *  *  *  *  *  *  *  *  *  *  *  *   * |
|-3          -2            -1           0            1             2           3 |
+--------------------------------------------------------------------------------+
                                       x
y
Mixed Plot
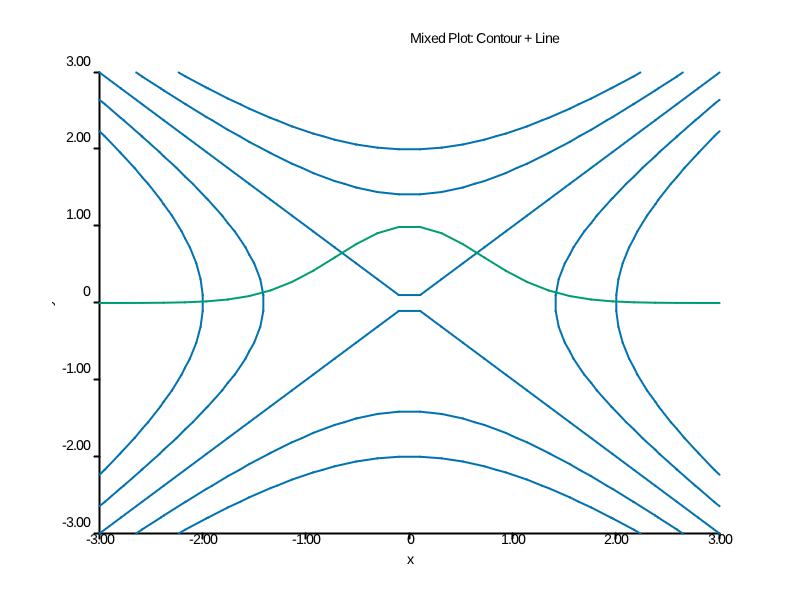
ASCII output:
                           Mixed Plot: Contour + Line
+--------------------------------------------------------------------------------+
| 3                                                                              |
| *   -    -                                                         -    -    - |
| *--------------                                               ---------------  |
| 2------- ----  ------                                   ------  ----  -------- |
| * ---- ----  -----   --------                   --------   -----  ---- ---- -- |
| *--- ----  ----  ------     ---------------------     ------  ----  ---- ---   |
| *  ---  ----   ----    -------                 -------    ----   ----  ---     |
| 1     --   ---    ----       -------------------       ----    ---   --        |
| *      ---    ---     ----                         ----     ---    ---         |
| *        ---    ---      ----- = ==  = =  == = ----       ---    ---           |
| *          --     --       = ==--           --== =       --     --             |
| 0           -      --= = ==      ---    ----      == = =--      -              |
| * =  = =  = -= =  = -               ----                - =  = =- =  = =  =  = |
| *           -      --            ----   ----            --      -              |
| *          --     --         ----           ----         --     --             |
| -1       ---    ---       ----                 ----       ---    ---           |
| *      ---    ---     ----                         ----     ---    ---         |
| *     --   ---    ----       -------------------       ----    ---   --        |
| *  ---  ----   ----    -------                 -------    ----   ----  ---     |
| -2-- ----  ----  ------     ---------------------     ------  ----  ---- ---   |
| * ---- ----  -----   --------                   --------   -----  ---- ---- -- |
| *------  ----  ------                                   ------  ----  -------- |
| *--*--*--*--*--*  *  *  *  *  *  *  *   *  *  *  *  *  *  *  *--*--*--*--*---* |
|-3          -2            -1           0            1             2           3 |
+--------------------------------------------------------------------------------+
                                       x
y
Ripple Coolwarm
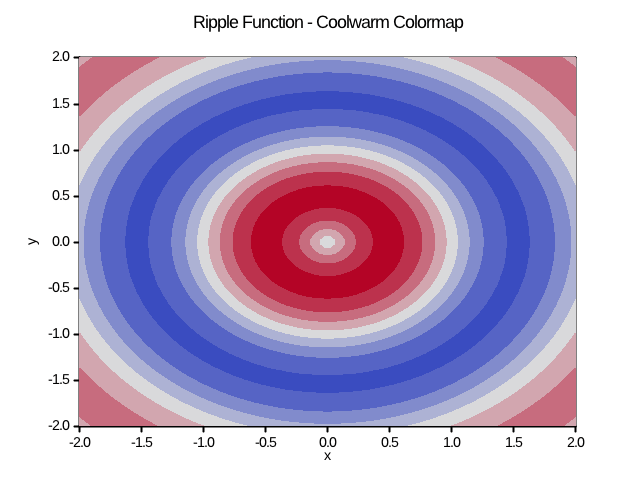
ASCII output:
                      Ripple Function - Coolwarm Colormap
+--------------------------------------------------------------------------------+
| 2.0                                                                            |
| *#++++++++++#######%%%%%%%#########################%%%%%%%#######++++++++++### |
| 1.5++++######%%%%%######+++++++++===========+++++++++######%%%%%######+++++### |
| *++######%%%%####+++++=============-------=============+++++####%%%%######++++ |
| *####%%%%###++++=======-------------------------------=======++++###%%%%#####+ |
| 1.0%%%###+++=====------------------=======------------------=====+++###%%%%### |
| *%%###+++=====----------===========+++++++===========----------=====+++###%%%# |
| %###+++====---------=====+++++#################+++++=====---------====+++###%% |
| 0.5++====-------=====+++###%%%%######+++######%%%%###+++=====-------====+++##% |
| *+++====------====+++##%%###++++-------------++++###%%##+++====------====+++## |
| *++====-----====+++##%%##++----:::---------:::----++##%%##+++====-----====+++# |
| 0.0====-----===+++##%##++---:::---+++###+++---:::---++##%##+++===-----====+++# |
| +++====----====++##%%#++---::::---++#####++---::::---++#%%##++====----====+++# |
| *++====-----===+++##%##++---:::---+++###+++---:::---++##%##+++===-----====+++# |
| -0.5===-----====+++##%%##++----:::---------:::----++##%%##+++====-----====+++# |
| *+++====------====+++##%%###++++-------------++++###%%##+++====------====+++## |
| *#+++====-------=====+++###%%%%######+++######%%%%###+++=====-------====+++##% |
| -1.0+++====---------=====+++++#################+++++=====---------====+++###%% |
| *%%###+++=====----------===========+++++++===========----------=====+++###%%%# |
| *#%%%%###+++=====------------------=======------------------=====+++###%%%%### |
| -1.5#%%%%###++++=======-------------------------------=======++++###%%%%#####+ |
| *++######%%%%####+++++=============-------=============+++++####%%%%######++++ |
| *+++*++##*###*%%%%*###*#+++*+++*+===*===*===+*+++*+++#*###*%%%%*###*##++*++++* |
|-2.0     -1.5      -1.0      -0.5      0.0       0.5       1.0       1.5    2.0 |
+--------------------------------------------------------------------------------+
                                       x
y
Ripple Inferno
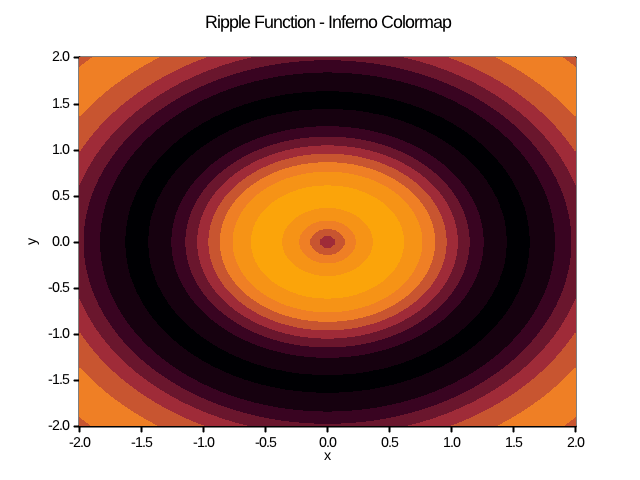
ASCII output:
                       Ripple Function - Inferno Colormap
+--------------------------------------------------------------------------------+
| 2.0                                                                            |
| *=%%%%%%%%%%=======-------.........................-------=======%%%%%%%%%%=== |
| 1.5%%%%======-----.......-.........................-.......-----======%%%%%=== |
| *%%======----...........                             ...........----======%%%% |
| *====----........                                           ........----=====% |
| 1.0---......                                                     ......----=== |
| *--......                     .................                     ......---= |
| -......                 ....-...................-....                 ......-- |
| 0.5..               .......----======%%%======----.......               .....- |
| *..               .....--===%%%%*************%%%%===--.....               .... |
| *.               ....--==%%***********************%%==--....               ... |
| 0.0             ....-==%%*********%%%===%%%*********%%==-....               .. |
|                 ...--=%%**********%%=====%%**********%%=--...               .. |
| *               ....-==%%*********%%%===%%%*********%%==-....               .. |
| -0.5             ....--==%%***********************%%==--....               ... |
| *..               .....--===%%%%*************%%%%===--.....               .... |
| *....               .......----======%%%======----.......               .....- |
| -1.0...                 ....-...................-....                 ......-- |
| *--......                     .................                     ......---= |
| *=----......                                                     ......----=== |
| -1.5=----........                                           ........----=====% |
| *%%======----...........                             ...........----======%%%% |
| *%%%*%%==*===*----*...*..  *   *    *   *    *   *  ..*...*----*===*==%%*%%%%* |
|-2.0     -1.5      -1.0      -0.5      0.0       0.5       1.0       1.5    2.0 |
+--------------------------------------------------------------------------------+
                                       x
y
Ripple Jet
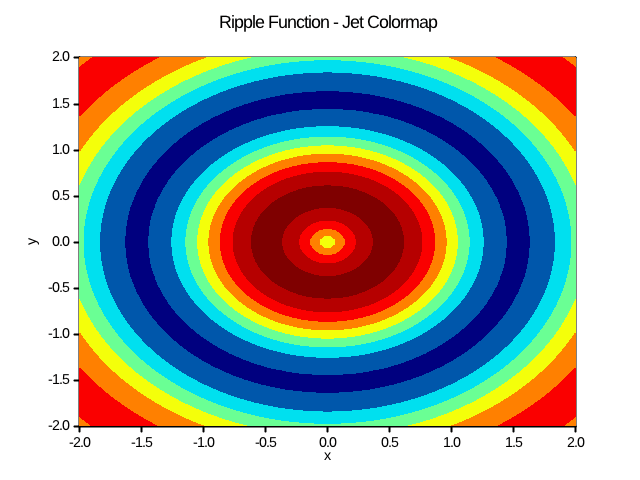
ASCII output:
                         Ripple Function - Jet Colormap
+--------------------------------------------------------------------------------+
| 2.0                                                                            |
| *+::::::::::+++++++%%%%%%%#########################%%%%%%%+++++++::::::::::+++ |
| 1.5::::++++++%%%%%######*********-----------*********######%%%%%++++++:::::+++ |
| *::++++++%%%%####*****---------------------------------*****####%%%%++++++:::: |
| *++++%%%%###****---------------------------------------------****###%%%%+++++: |
| 1.0%%%###***----------- ----------------------------- -----------***###%%%%+++ |
| *%%###***--------- ----------------*******---------------- ---------***###%%%+ |
| %###***-------- ---------*****#################*****--------- --------***###%% |
| 0.5**-------  -------***###%%%%++++++:::++++++%%%%###***-------  -------***##% |
| ****------  ------***##%%+++:::::::::::::::::::::+++%%##***------  ------***## |
| ***------  -----***##%%++::::::...:::::::::...::::::++%%##***-----  ------***# |
| 0.0-----  -----***##%++:::::...::::::+++::::::...:::::++%##***-----  -----***# |
| ***-----  -----**##%%+:::::....:::::+++++:::::....:::::+%%##**-----  -----***# |
| ***-----  -----***##%++:::::...::::::+++::::::...:::::++%##***-----  -----***# |
| -0.5-----  -----***##%%++::::::...:::::::::...::::::++%%##***-----  ------***# |
| ****------  ------***##%%+++:::::::::::::::::::::+++%%##***------  ------***## |
| *#***-------  -------***###%%%%++++++:::++++++%%%%###***-------  -------***##% |
| -1.0***-------- ---------*****#################*****--------- --------***###%% |
| *%%###***--------- ----------------*******---------------- ---------***###%%%+ |
| *+%%%%###***----------- ----------------------------- -----------***###%%%%+++ |
| -1.5+%%%%###****---------------------------------------------****###%%%%+++++: |
| *::++++++%%%%####*****---------------------------------*****####%%%%++++++:::: |
| *:::*::++*+++*%%%%*###*#*********---*---*---*********#*###*%%%%*+++*++::*::::* |
|-2.0     -1.5      -1.0      -0.5      0.0       0.5       1.0       1.5    2.0 |
+--------------------------------------------------------------------------------+
                                       x
y