Annotation Demo
Annotation Demo
Source: annotation_demo.f90
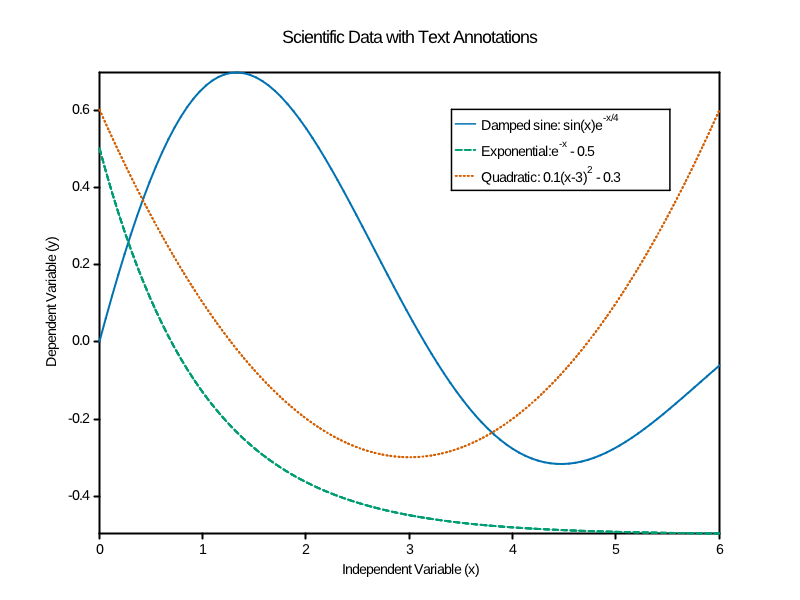
Add text annotations in data coordinates.
Files
annotation_demo.f90- Source code- Generated media in
output/example/fortran/annotation_demo/
Running
make example ARGS="annotation_demo"
Output
Annotation Demo
ASCII output:
                     Scientific Data with Text Annotations
+--------------------------------------------------------------------------------+
|                                                                                |
| |                                     SCIENTIFIC ANALYSIS                      |
| |                                                                              |
| 0.6            *****Peak Region           --- Damped sine: sin(x)e^(-x/4)      |
| |          Upper Left  ** .  . .          - - Exponential: e^(-x) - 0.5        |
| |  ##       **           **               ... Quadratic: 0.1(x-3)^2 - 0.3      |
| |   #      *              **         Maximum: (1.33, .70)               #      |
| 0.4% #    *                 *                       Upper Right        #       |
| |   % ## *                   **           d f/d x = cos(x)e^(-x/4) - 1/4sin(x) |
| |   %  #**                     *                                     #         |
| |    % *##                     **                                  ##          |
| |     %* ##                      *                                ##           |
| 0.2   *%   #                     **                              #             |
| |    * %   ##                      **                           ##             |
| |       %    ##                     *                         ##               |
| |   *    %    ##                     **                  Transition Zone       |
| 0.0 *     %     #                     *                     #                  |
| |  *       %     ##                    **                 ##                   |
| |           %      ##                   **              ##               *     |
| |            %%      ##                   **          ##  lim_(x->inf) e^(-x)  |
| |             %%%      ##                  **       ##              **         |
| -0.2            %%       ###                 **  ###             ***           |
| |                 %%        ####             ##%%             ****             |
| |                   %%%        #Critical Point   *****   *****Asymptote        |
| |                      %%%%                           ****                     |
| -0.4                      %%%%%%                                               |
| |                              %%%%%%%%%%                     .  .  .          |
| |                <                       %%%%%%%%%%%%%%%%%%%%%%%%%%%%%%%%%     |
| +--+----------+-----------+-----------+-----------+-----------+----------+---- |
|    0          1           2           3           4           5          6     |
+--------------------------------------------------------------------------------+
                            Independent Variable (x)
Dependent Variable (y)