Pie Chart Demo
Pie Chart Demo
Source: pie_chart_demo.f90
Build pie charts using both the stateful API and figure_t (exploded wedges, autopct, and start angles).
Outputs are written in PNG, PDF, and ASCII formats.
Run it with:
make example ARGS="pie_chart_demo"
Generated media is written to output/example/fortran/pie_chart_demo/.
Files
pie_chart_demo.f90- Source code- Generated media in
output/example/fortran/pie_chart_demo/
Running
make example ARGS="pie_chart_demo"
Output
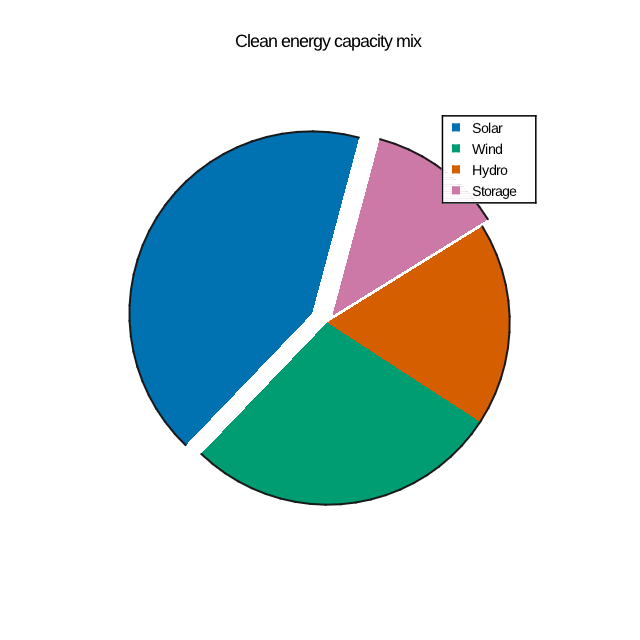
Oo Energy
ASCII output:
                           Clean energy capacity mix
+--------------------------------------------------------------------------------+
|                                                                                |
|                                                                                |
|                                                                                |
|                                                             -  Solar (42%)     |
|                                                             =  Wind (28%)      |
|                                    ---                      %  Hydro (18%)     |
|                              ------------- ----             #  Storage (12%)   |
|                          ----------------  -------                             |
|                         ----------------   ---------                           |
|                       ------------------  ------------                         |
|                     -------------------   -----------=-                        |
|                     -------------------  ---------=====                        |
|                    -------------------   ------=========                       |
|                   --------------------  ----=============                      |
|                   -------------------   -================                      |
|                   ------------------- +==================                      |
|                   -----------------  +++++===============                      |
|                    --------------  ++++++++++============                      |
|                     -----------  +++++++++++++++========                       |
|                     ---------  ++++++++++++++++++++=====                       |
|                       -----  +++++++++++++++++++++++++                         |
|                        --  ++++++++++++++++++++++++++                          |
|                          ++++++++++++++++++++++++++                            |
|                             +++++++++++++++++++++                              |
|                                 +++++++++++++                                  |
|                                                                                |
|                                                                                |
|                                                                                |
|                                                                                |
|                                                                                |
+--------------------------------------------------------------------------------+
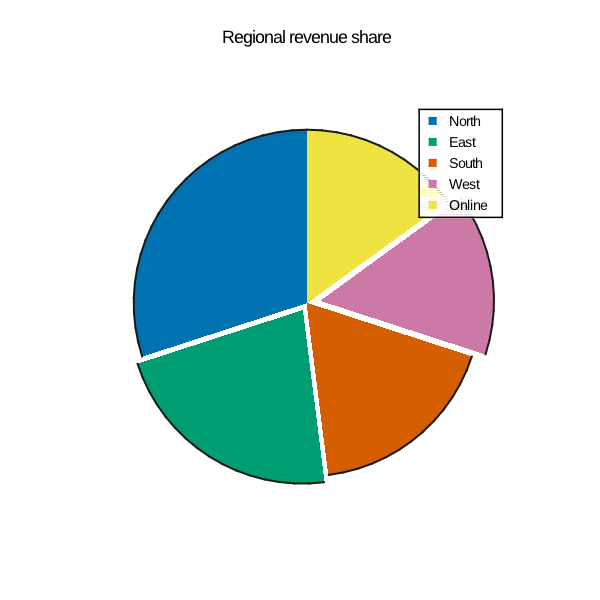
Stateful Sales
ASCII output:
                             Regional revenue share
+--------------------------------------------------------------------------------+
|                                                                                |
|                                                                                |
|                                                                                |
|                                                            -  North (30.0%)    |
|                                                            =  East (22.0%)     |
|                                                            %  South (18.0%)    |
|                                 -------======              #  West (15.0%)     |
|                             -----------==========          @  Online (15.0%)   |
|                          --------------=============                           |
|                         ---------------============== -                        |
|                       -----------------=============----                       |
|                      ------------------==========--------                      |
|                     -------------------========-----------                     |
|                     -------------------=====---------------                    |
|                     -------------------===-----------------                    |
|                     ---------------------------------------                    |
|                     -------------++++++======--------------                    |
|                     -------++++++++++++============-------                     |
|                     -++++++++++++++++++==================-                     |
|                      ++++++++++++++++++=================                       |
|                      +++++++++++++++++++==============                         |
|                        +++++++++++++++++==============                         |
|                         ++++++++++++++++===========                            |
|                           ++++++++++++++=========                              |
|                              +++++++++++======                                 |
|                                    ++++++                                      |
|                                                                                |
|                                                                                |
|                                                                                |
|                                                                                |
+--------------------------------------------------------------------------------+