Bar Chart Demo
Bar Chart Demo
Source: bar_chart_demo.f90
Demonstrates grouped bar charts (vertical and horizontal) via both the stateful API and figure_t.
bar_chart_demo.f90- Source demonstrating grouped and horizontal bars- Generated outputs in
output/example/fortran/bar_chart_demo/
make example ARGS="bar_chart_demo"
- Grouped bars: Compare multiple series per category
- Horizontal bars: Present ranked metrics across categories
- OO workflow: Call
bar_implwith an explicitfigure_tinstance to avoid globals - Multiple formats: Save PNG, PDF, and ASCII outputs for each scenario
Running the demo generates:
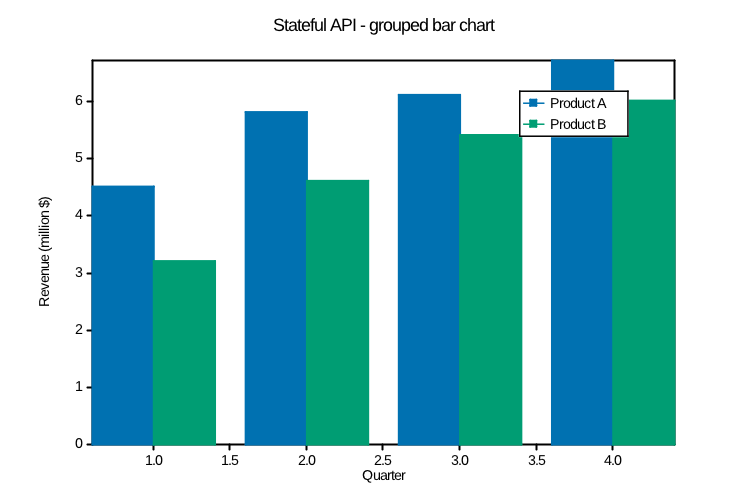
- stateful_grouped.(png|pdf|txt) - Vertical grouped comparison
- stateful_horizontal.(png|pdf|txt) - Horizontal completion chart
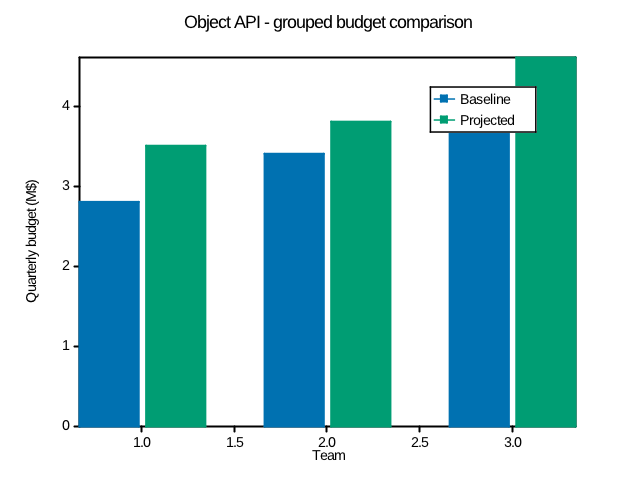
- oo_grouped.(png|pdf|txt) - Object API grouped budget comparison
Perfect for showcasing categorical comparisons and verifying bar chart support in fortplot.
Files
bar_chart_demo.f90- Source code- Generated media in
output/example/fortran/bar_chart_demo/
Running
make example ARGS="bar_chart_demo"
Output
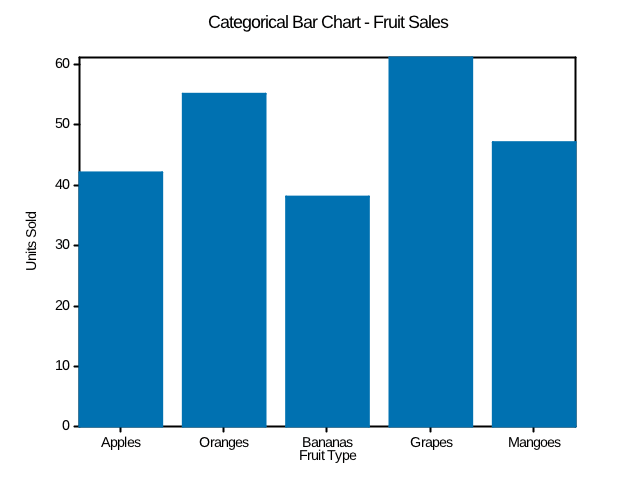
Categorical Labels
ASCII output:
                      Categorical Bar Chart - Fruit Sales
+--------------------------------------------------------------------------------+
|                                                                                |
| 60                                                                             |
| |                                              ------------                    |
| 50                                             ------------                    |
| |                 ------------                 ------------                    |
| |                 ------------                 ------------                    |
| |                 ------------                 ------------                    |
| |                 ------------                 ------------  -------------     |
| 40                ------------                 ------------  -------------     |
| |  -------------  ------------                 ------------  -------------     |
| |  -------------  ------------  -------------  ------------  -------------     |
| |  -------------  ------------  -------------  ------------  -------------     |
| 30 -------------  ------------  -------------  ------------  -------------     |
| |  -------------  ------------  -------------  ------------  -------------     |
| |  -------------  ------------  -------------  ------------  -------------     |
| |  -------------  ------------  -------------  ------------  -------------     |
| 20 -------------  ------------  -------------  ------------  -------------     |
| |  -------------  ------------  -------------  ------------  -------------     |
| |  -------------  ------------  -------------  ------------  -------------     |
| 10 -------------  ------------  -------------  ------------  -------------     |
| |  -------------  ------------  -------------  ------------  -------------     |
| |  -------------  ------------  -------------  ------------  -------------     |
| +-------+--------------+--------------+--------------+--------------+--------- |
|      Apples         Oranges        Bananas        Grapes         Mangoes       |
+--------------------------------------------------------------------------------+
                                   Fruit Type
Units Sold
Oo Grouped
ASCII output:
                     Object API - grouped budget comparison
+--------------------------------------------------------------------------------+
|                                                                                |
| |                                                                              |
| |                                                                #+++#+++#     |
| 4       Baseline                                                 ++++++++#     |
| |       Projected                                                #+++++++#     |
| 3                                                                #+++++++#     |
| |                                      #+++#+++#       ----------#+++++++#     |
| |           #+++#++++#                 #+++++++#       ----------#+++++++#     |
| |           #++++++++#       --------- #+++++++#       ----------#+++++++#     |
| |           #++++++++#       --------- #+++++++#       ----------#+++++++#     |
| |  ---------#++++++++#       --------- #+++++++#       ----------#+++++++#     |
| |  ---------#++++++++#       --------- #+++++++#       ----------#+++++++#     |
| |  ---------#++++++++#       --------- #+++++++#       ----------#+++++++#     |
| 2  ---------#++++++++#       --------- #+++++++#       ----------#+++++++#     |
| |  ---------#++++++++#       --------- #+++++++#       ----------#+++++++#     |
| |  ---------#++++++++#       --------- #+++++++#       ----------#+++++++#     |
| |  ---------#++++++++#       --------- #+++++++#       ----------#+++++++#     |
| |  ---------#++++++++#       --------- #+++++++#       ----------#+++++++#     |
| 1  ---------#++++++++#       --------- #+++++++#       ----------#+++++++#     |
| |  ---------#++++++++#       --------- #+++++++#       ----------#+++++++#     |
| |  ---------#++++++++#       --------- #+++++++#       ----------#+++++++#     |
| |  ---------#++++++++#       --------- #+++++++#       ----------#+++++++#     |
| +----------+#---#----#----------------+#---#---#-----------------#---#---#---- |
|         Team 1                     Team 2                     Team 3           |
+--------------------------------------------------------------------------------+
                                      Team
Quarterly budget (M)
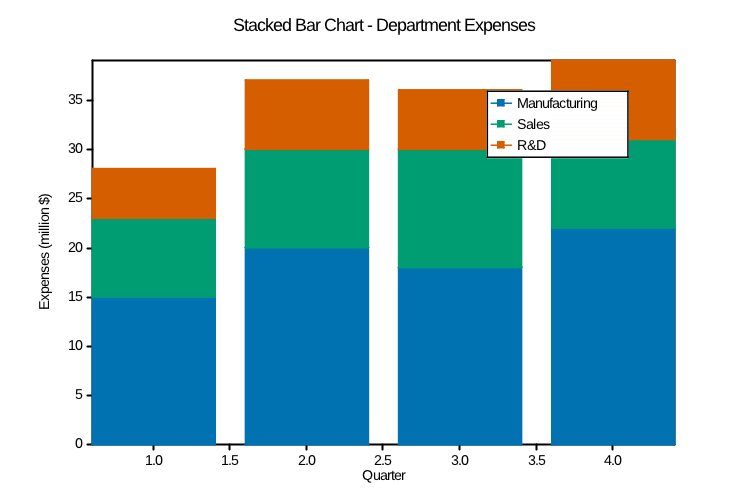
Stacked Bars
ASCII output:
                    Stacked Bar Chart - Department Expenses
+--------------------------------------------------------------------------------+
|                                                                                |
| |                                                                              |
| 35                                                        #===#===#==#===#     |
| |       Manufacturing ===#===#==#===#                     #==============#     |
| |       Sales         ==============#   #===#==#===#===#  #==============#     |
| 30      R&D           ==============#   #==============#  #==============#     |
| 25                   #==============#   #==============#  #+++#+++#++#+++#     |
| |                    #+++#+++#++#+++#   #+++#++#+++#+++#  #++++++++++++++#     |
| |  #===#==#===#===#  #++++++++++++++#   #++++++++++++++#  #++++++++++++++#     |
| |  #==============#  #++++++++++++++#   #++++++++++++++#  #++++++++++++++#     |
| |  #==============#  #++++++++++++++#   #++++++++++++++#  #++++++++++++++#     |
| 20 #+++#++#+++#+++#  #++++++++++++++#   #++++++++++++++#  #---#---#--#---#     |
| |  #++++++++++++++#  #---#---#--#---#   #++++++++++++++#  ----------------     |
| |  #++++++++++++++#  ----------------   #++++++++++++++#  ----------------     |
| |  #++++++++++++++#  ----------------   #---#--#---#---#  ----------------     |
| 15 #---#--#---#---#  ----------------   ----------------  ----------------     |
| |  ----------------  ----------------   ----------------  ----------------     |
| |  ----------------  ----------------   ----------------  ----------------     |
| 10 ----------------  ----------------   ----------------  ----------------     |
| |  ----------------  ----------------   ----------------  ----------------     |
| |  ----------------  ----------------   ----------------  ----------------     |
| 5  ----------------  ----------------   ----------------  ----------------     |
| |  ----------------  ----------------   ----------------  ----------------     |
| ++--------+--------+---------+--------+--------+---------+--------+--------+-- |
| 0.5      1.0      1.5       2.0      2.5      3.0       3.5      4.0      4.5  |
+--------------------------------------------------------------------------------+
                                    Quarter
Expenses (million )
Stateful Grouped
ASCII output:
                        Stateful API - grouped bar chart
+--------------------------------------------------------------------------------+
| 7                                                                              |
| |                                                                              |
| |                                                                              |
| 6       Product A                                         ---------            |
| 5       Product B                       --------          ---------            |
| |                    ---------          --------          --------#+++#++#     |
| |                    ---------          --------          --------#++++++#     |
| |                    ---------          -------#+++#+++#  --------#++++++#     |
| |                    ---------          -------#+++++++#  --------#++++++#     |
| |  --------          --------#++#+++#   -------#+++++++#  --------#++++++#     |
| 4  --------          --------#++++++#   -------#+++++++#  --------#++++++#     |
| |  --------          --------#++++++#   -------#+++++++#  --------#++++++#     |
| |  --------          --------#++++++#   -------#+++++++#  --------#++++++#     |
| 3  -------#+++#+++#  --------#++++++#   -------#+++++++#  --------#++++++#     |
| |  -------#+++++++#  --------#++++++#   -------#+++++++#  --------#++++++#     |
| |  -------#+++++++#  --------#++++++#   -------#+++++++#  --------#++++++#     |
| |  -------#+++++++#  --------#++++++#   -------#+++++++#  --------#++++++#     |
| 2  -------#+++++++#  --------#++++++#   -------#+++++++#  --------#++++++#     |
| |  -------#+++++++#  --------#++++++#   -------#+++++++#  --------#++++++#     |
| |  -------#+++++++#  --------#++++++#   -------#+++++++#  --------#++++++#     |
| 1  -------#+++++++#  --------#++++++#   -------#+++++++#  --------#++++++#     |
| |  -------#+++++++#  --------#++++++#   -------#+++++++#  --------#++++++#     |
| |  -------#+++++++#  --------#++++++#   -------#+++++++#  --------#++++++#     |
| +---------#---#---#----------#--#---#----------#---#---#----------#---#--#---- |
|          Q1                 Q2                Q3                 Q4            |
+--------------------------------------------------------------------------------+
                                    Quarter
Revenue (million )
Stateful Horizontal
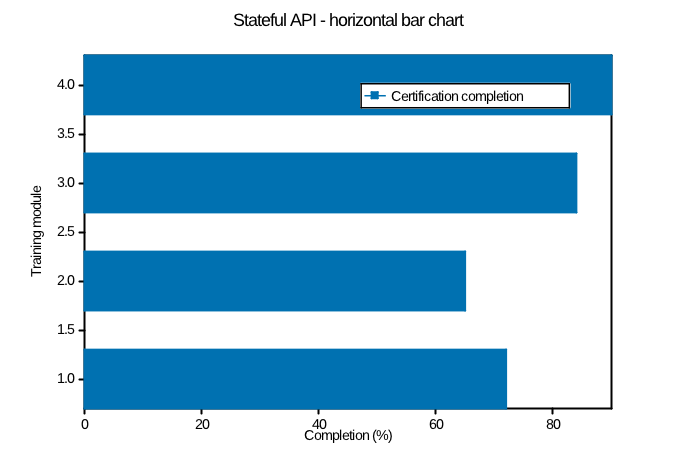
ASCII output:
                      Stateful API - horizontal bar chart
+--------------------------------------------------------------------------------+
|                                                                                |
| 4.0                                                                            |
| |-------------------------------------------------------------------------     |
| |--     Certification completion -----------------------------------------     |
| |-------------------------------------------------------------------------     |
| |-------------------------------------------------------------------------     |
| 3.5                                                                            |
| |--------------------------------------------------------------------          |
| |--------------------------------------------------------------------          |
| |--------------------------------------------------------------------          |
| |--------------------------------------------------------------------          |
| 3.0                                                                            |
| 2.5                                                                            |
| 2.0--------------------------------------------------                          |
| |----------------------------------------------------                          |
| |----------------------------------------------------                          |
| |----------------------------------------------------                          |
| 1.5                                                                            |
| |----------------------------------------------------------                    |
| 1.0--------------------------------------------------------                    |
| |----------------------------------------------------------                    |
| +---------------+---------------+----------------+---------------+------------ |
| 0              20              40               60              80             |
+--------------------------------------------------------------------------------+
                                 Completion (%)
Training module