Twin Axes Demo
Twin Axes Demo
Source: twin_axes_demo.f90
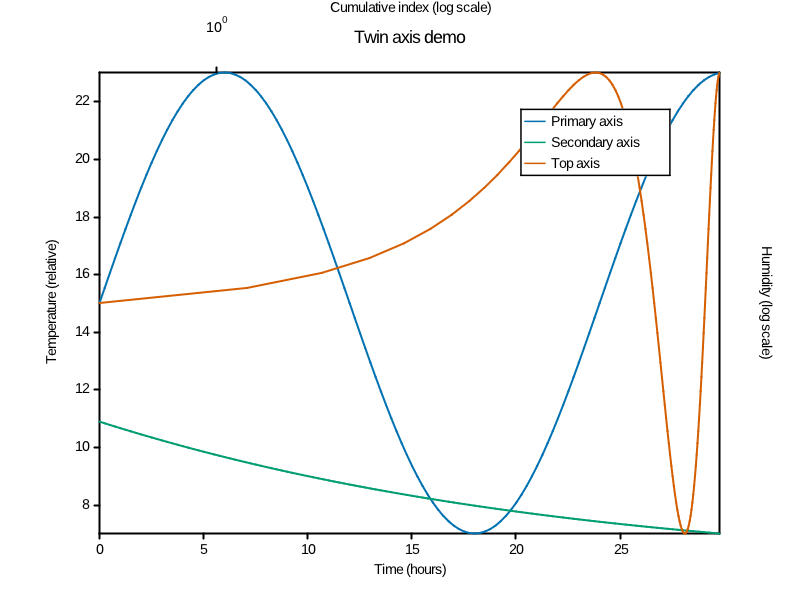
Demonstrates twinx and twiny for multiple axes on one figure.
The demo plots three synthetic time series and assigns each to a different axis:
- Left y-axis: primary signal (temperature-like)
- Right y-axis: secondary signal with log scaling
- Top x-axis: cumulative index with log scaling
Run the example via:
make example ARGS="twin_axes_demo"
Outputs are written to output/example/fortran/twin_axes_demo/ in PNG and ASCII
formats.
Files
twin_axes_demo.f90- Source code- Generated media in
output/example/fortran/twin_axes_demo/
Running
make example ARGS="twin_axes_demo"
Output
Twin Axes Demo
ASCII output:
                                 Twin axis demo
+--------------------------------------------------------------------------------+
|                    Cumulative index (log scale)                                |
| 1           2x1            3x1            4x1         5x1                      |
||                                                                               |
||  # --- Primary axis                               ###          -#     5x1e1   |
||    --- Secondary axis                           ###  ##      -- #             |
|22   --- Top axis                               ##      #    --  #              |
||      ## --         --                        ##       ##  --   #      4.9x1e1 |
||       ###           --                      #          #  -    #              |
|20      --###          --                  ###           ##-     #              |
||      --   ##          -                ###              #      #      4.8x1e1 |
||     --      ##         -             ###               -#      #              |
|18    -         ##       --         ###                 --#      #              |
||    -            ##      --    ####                   -- ##     #      4.7x1e1 |
||   --             ###    ## ##                        -   #     #              |
|16 --        #    #  ####   -                         --   #    ##              |
||  #    #               ### --                        -    #    #               |
|14                        ###-                       -     ##   #       4.6x1e1 |
||                            ###                    --      #   #               |
||                             -####                --       #   #               |
|12                             -  ####             -        #   #       4.5x1e1 |
||                               -    ####         --        #   #               |
||                               --      ####     --         ##  #               |
|10                               --        #### --           #  #       4.4x1e1 |
||                                 --           ####          # ##               |
||                                  --         --  #####      # #                |
|8                                   --       --        ##### # #        4.3x1e1 |
||                                    ---   ---             ######               |
||                                      -----                  #####     4.2x1e1 |
|+--+----------+---------+----------+---------+----------+---------+---          |
|   0          5        10         15        20         25        30             |
+--------------------------------------------------------------------------------+
                                  Time (hours)
Temperature (relative)