Subplot Demo
Subplot Demo
Source: subplot_demo.f90
Demonstration of subplot functionality using the stateful API.
make example ARGS="subplot_demo"
- 2x2 subplot grid: Four different mathematical functions arranged in a 2×2 grid
- 1x3 subplot layout: Three polynomial functions arranged horizontally
- Independent subplot titles and labels: Each subplot has its own title and axis labels
- Multiple plot types: Different mathematical functions visualized in each subplot
use fortplot, only: figure, plot, xlabel, ylabel, title, savefig, subplot

! Create figure and subplot grid
call figure(800, 600)
call subplot(rows, cols, index)  ! Create grid and switch to subplot

! Add content to current subplot
call plot(x, y)
call title('Subplot Title')
call xlabel('X Label')
call ylabel('Y Label')

! Save entire subplot grid
call savefig('output.png')
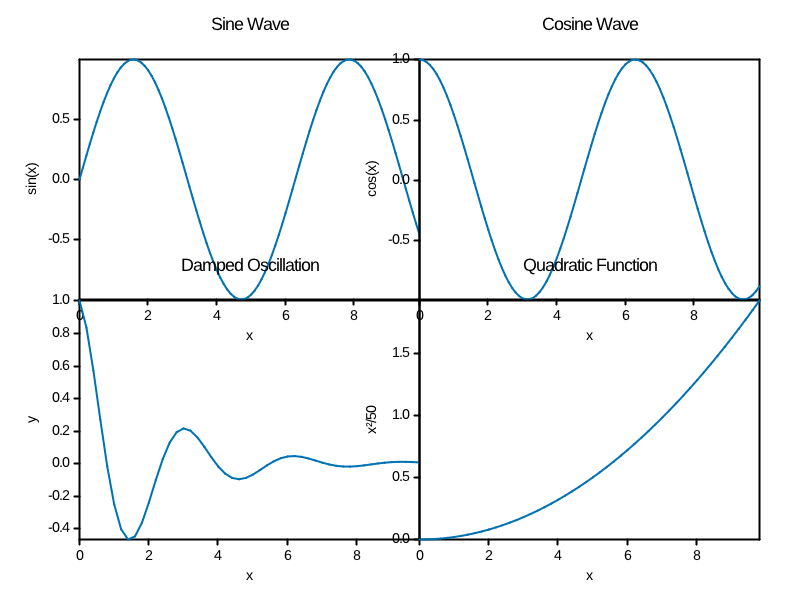
output/example/fortran/subplot_demo/subplot_2x2_demo.png: 2×2 grid showing sine, cosine, damped oscillation, and quadratic functions-
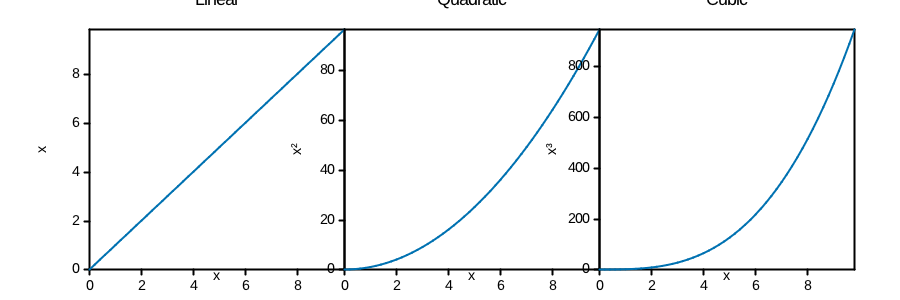
output/example/fortran/subplot_demo/subplot_1x3_demo.png: 1×3 layout showing linear, quadratic, and cubic functions -
Top-left: sin(x)
- Top-right: cos(x)
- Bottom-left: Damped oscillation e^(-x/2) * cos(2x)
-
Bottom-right: Quadratic function x²/50
-
Left: Linear function x
- Center: Quadratic function x²
- Right: Cubic function x³
Files
subplot_demo.f90- Source code- Generated media in
output/example/fortran/subplot_demo/
Running
make example ARGS="subplot_demo"
Output
Subplot 1X3 Demo
Subplot 2X2 Demo