3D Plotting
3D Plotting
Source: 3d_plotting.f90
3D plotting (lines and surfaces) with axes, ticks, and labels.
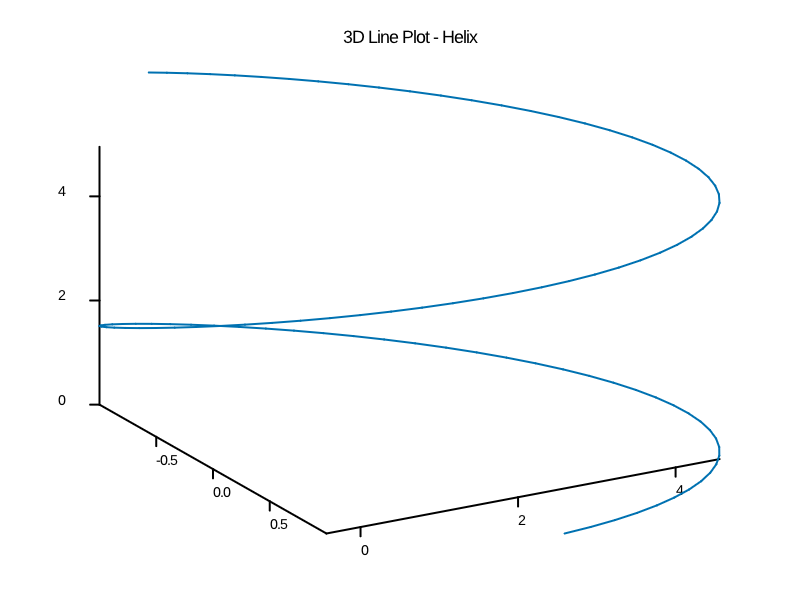
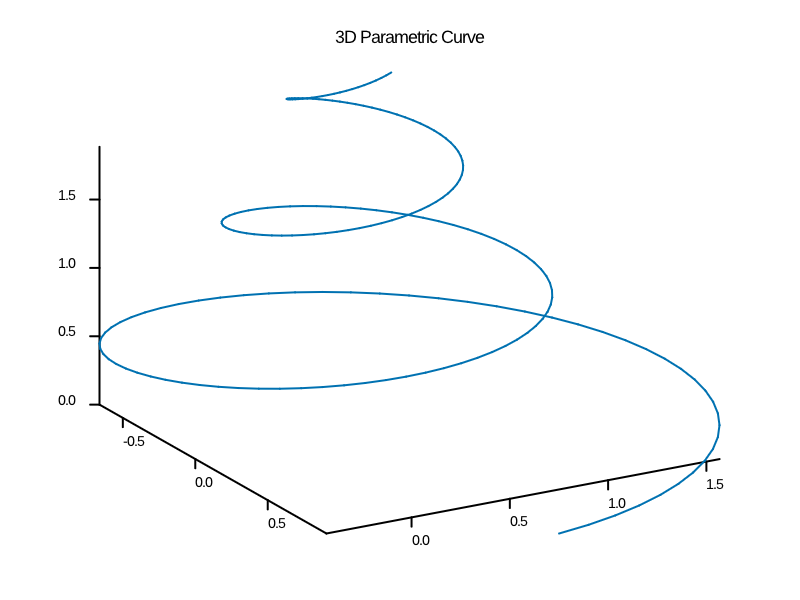
- 3D line plots: helices and parametric curves
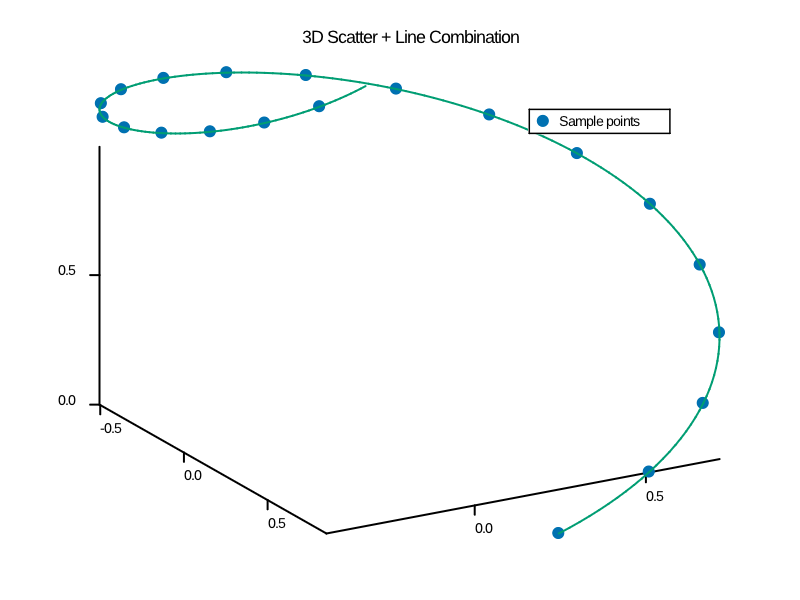
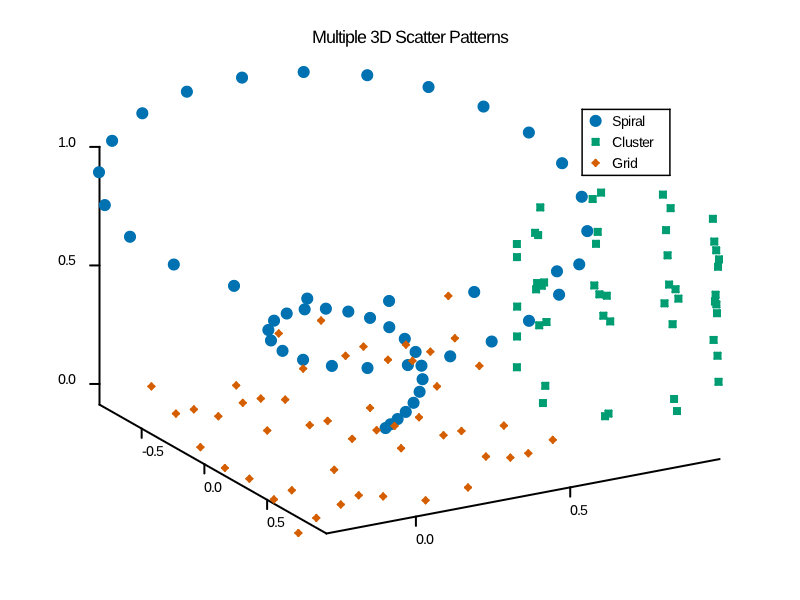
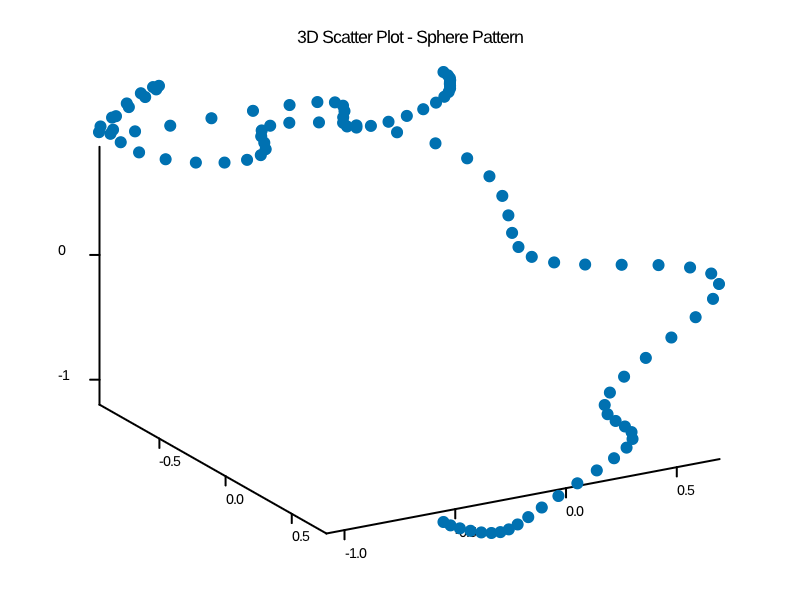
- 3D scatter plots: multiple patterns and marker types
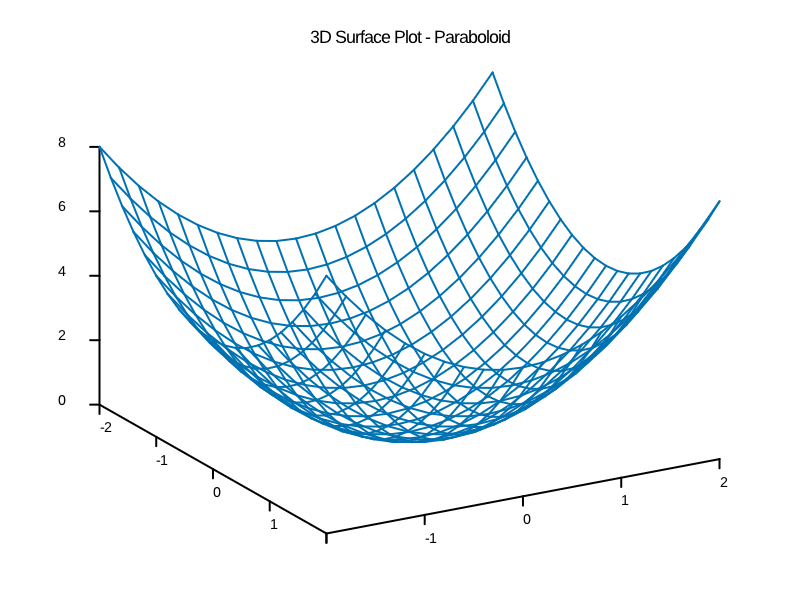
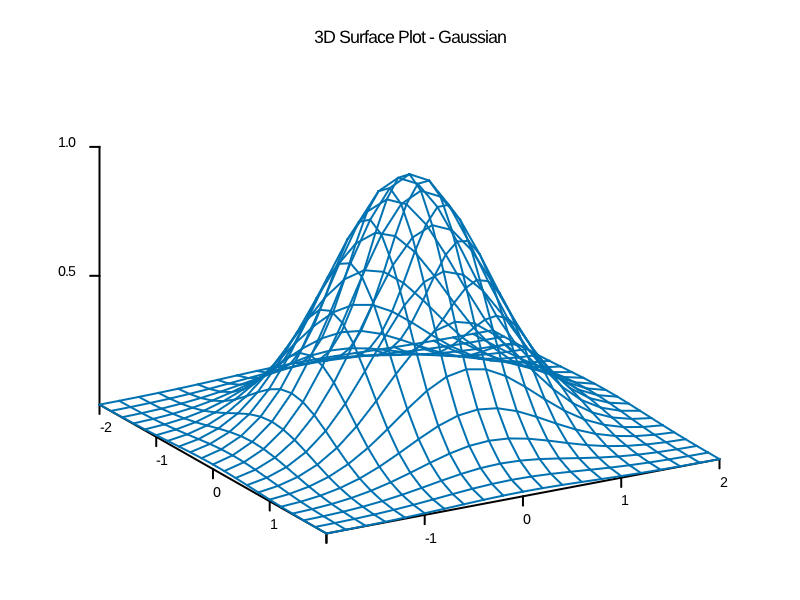
- 3D surface plots: mathematical functions and meshes
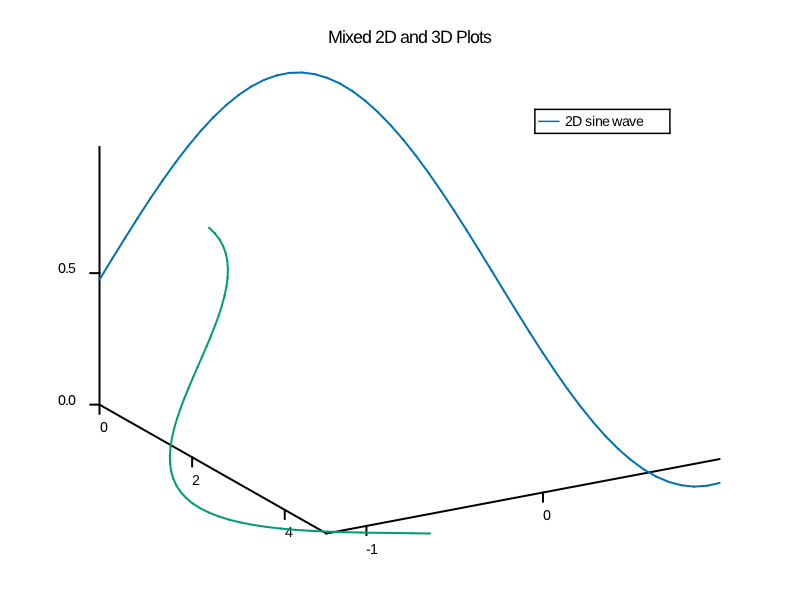
- Mixed plots: combining 2D and 3D in one figure
- Plot combinations: multiple 3D plot types together
make example ARGS="3d_plotting"
3d_helix.png- Basic 3D helix line plotparametric_curve.png- Parametric spiral curvescatter_sphere.png- 3D scatter in sphere patternscatter_multiple.png- Multiple scatter patterns with legendsurface_paraboloid.png- Paraboloid surface plotsurface_gaussian.png- Gaussian surface plotmixed_plots.png- Combined 2D and 3D plotsscatter_line_combo.png- 3D scatter + line combination
call fig%add_3d_plot(x, y, z, label="3D Line")
call fig%add_scatter_3d(x, y, z, label="Scatter", marker='o')
call fig%add_surface(x_grid, y_grid, z_grid, label="Surface")
- Automatic 3D Detection: fortplot automatically detects 3D data
- No Special Initialization: Same
fig%initialize()for 2D and 3D - Mixed Dimensionality: Can combine 2D and 3D plots in same figure
- Surface Grid Requirements:
size(z_grid,1) == size(x_grid)andsize(z_grid,2) == size(y_grid) - Memory Management: Uses allocatable arrays for efficient memory usage
Files
3d_plotting.f90- Source code- Generated media in
output/example/fortran/3d_plotting/
Running
make example ARGS="3d_plotting"
Output
3D Helix
Mixed Plots
Parametric Curve
Scatter Line Combo
Scatter Multiple
Scatter Sphere
Surface Filled Jet

Surface Filled Plasma

Surface Filled Viridis
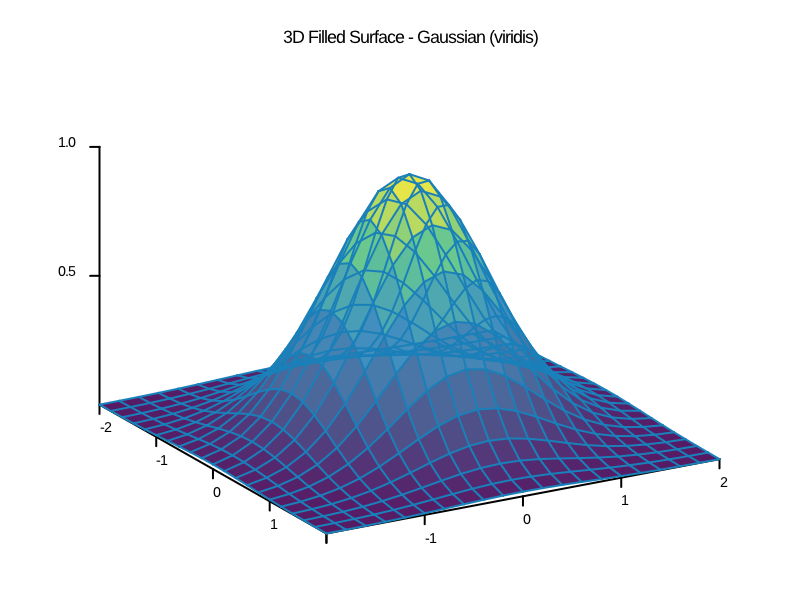
Surface Gaussian
Surface Paraboloid