Errorbar Demo
Errorbar Demo
Source: errorbar_demo.f90
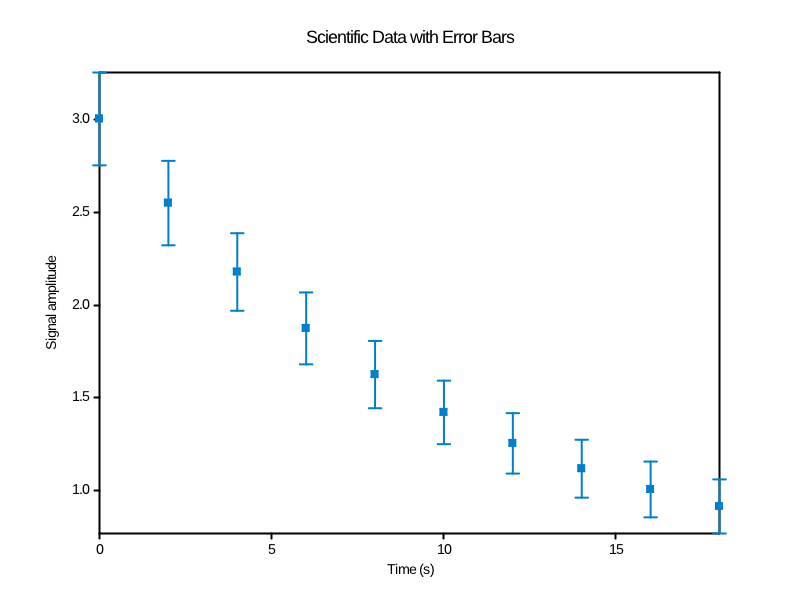
Demonstrates error bar plotting with both symmetric and asymmetric errors for scientific data visualization.
errorbar_demo.f90- Source code with comprehensive error bar exampleserrorbar_plot.png/pdf/txt- Example outputs
make example ARGS="errorbar_demo"
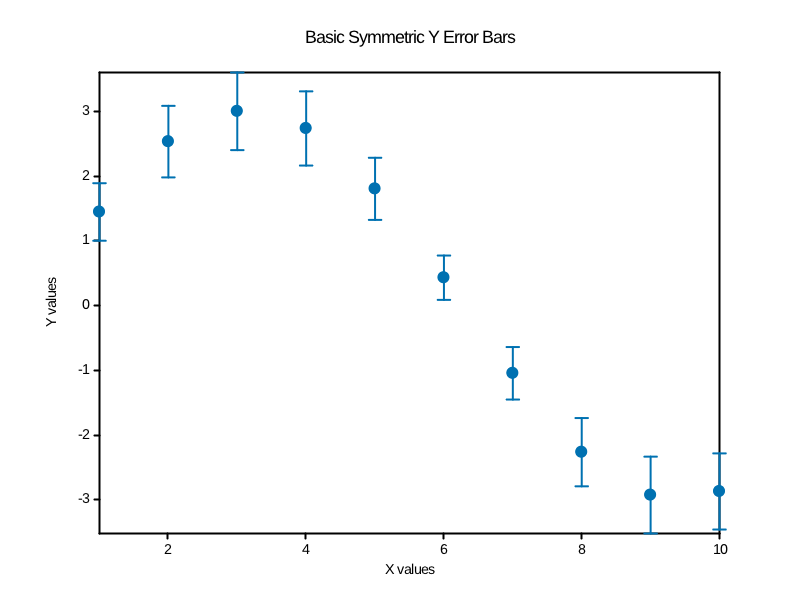
- Symmetric error bars: Single error value for both directions
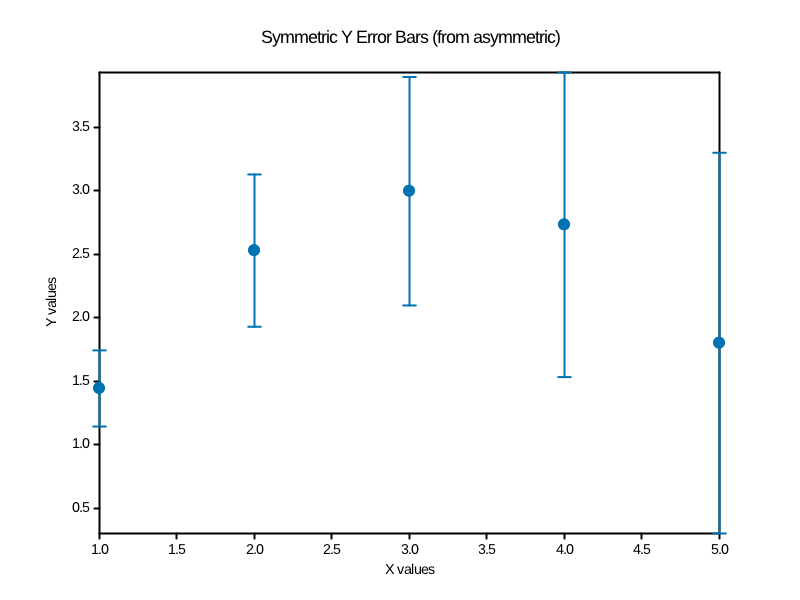
- Asymmetric error bars: Different upper and lower error bounds
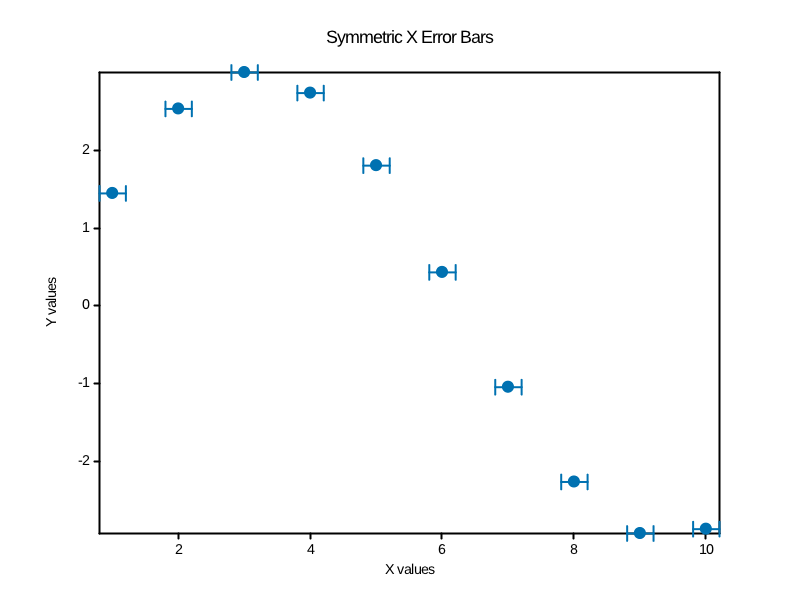
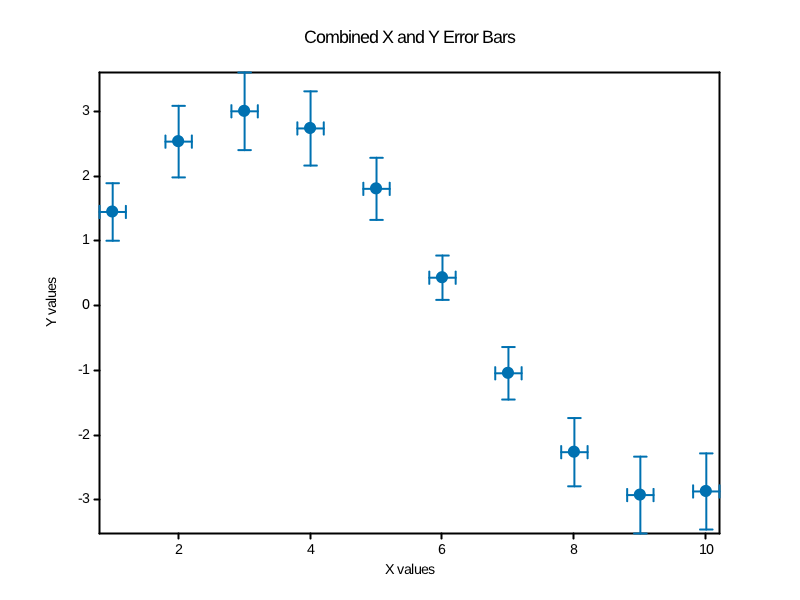
- X and Y errors: Error bars on both axes
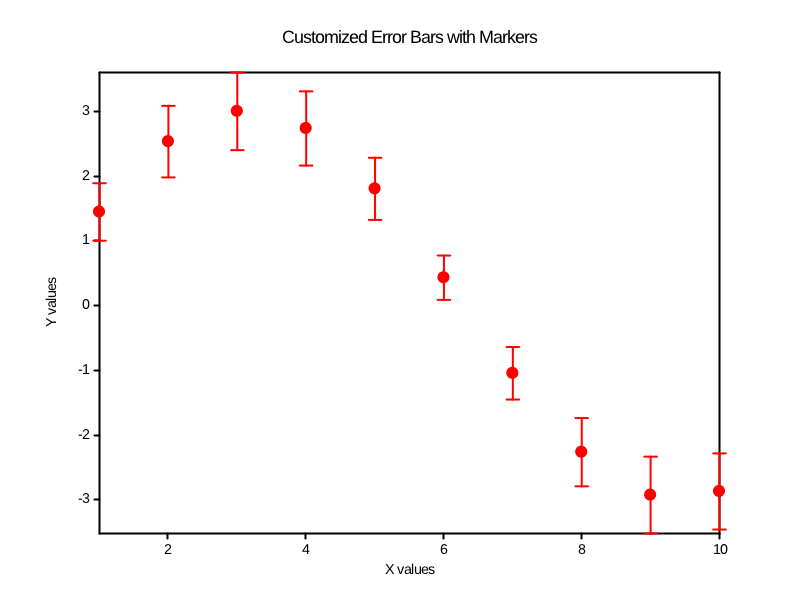
- Visual customization: Cap size, line width, colors, markers
- Multiple datasets: Comparing experimental data with different uncertainties
- Scientific styling: Professional presentation for publications
! Basic symmetric errors
call fig%errorbar(x, y, yerr=yerr, label='Data with errors')

! Asymmetric errors
call fig%errorbar(x, y, yerr_lower=y_lower, yerr_upper=y_upper)

! Custom styling
call fig%errorbar(x, y, yerr=yerr, capsize=8.0_wp, &
                  elinewidth=2.0_wp, marker='o', color=[1.0, 0.0, 0.0])
The demo generates examples showing: - Basic error bars with measurement uncertainty - Multiple datasets with different error magnitudes - Custom styling and professional scientific presentation
Perfect for scientific plotting where uncertainty visualization is essential.
Files
errorbar_demo.f90- Source code- Generated media in
output/example/fortran/errorbar_demo/
Running
make example ARGS="errorbar_demo"
Output
Errorbar Asymmetric
Errorbar Basic X
Errorbar Basic Y
Errorbar Combined
Errorbar Custom
Errorbar Scientific