Basic Plots
Basic Plots
Source: basic_plots.f90
Basic line plots and saving outputs (PNG, PDF, ASCII).
Files
basic_plots.f90- Source code- Generated media in
output/example/fortran/basic_plots/
Running
make example ARGS="basic_plots"
Output
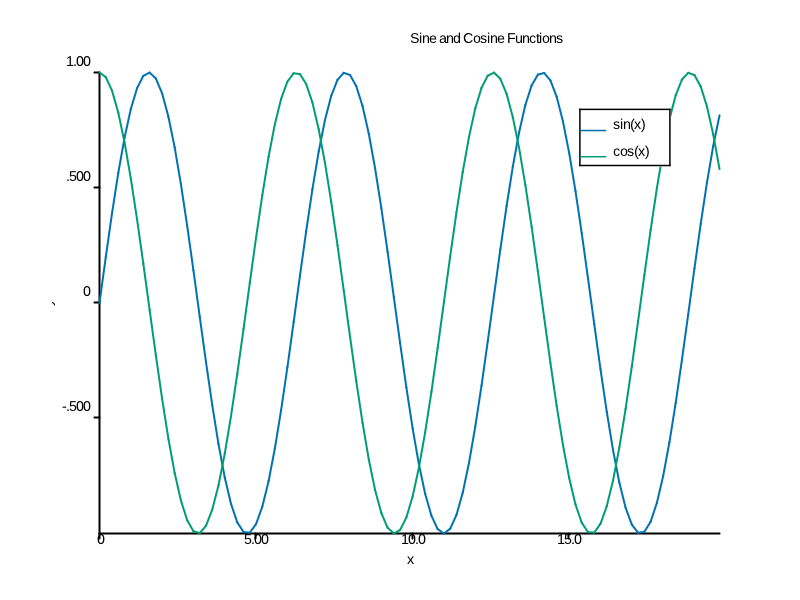
Multi Line

ASCII output:
                           Sine and Cosine Functions
+--------------------------------------------------------------------------------+
| 1.0                                                                            |
| *                                                                              |
| ==  ----               ===   ---               ====  ----               ===    |
|   =-                  =   = -   -             =     -   -          -- sin(x) - |
| *  -    -            =     =-    -           =     =-    -         -- cos(x)=  |
| 0.5=     -           =     -                 =      =     -           =     =  |
|   -=     -          =     - =     -          =     -=     -          =     - = |
| *-  =     -         =     - =     -         =     - =      -         =     -   |
|  -  =     -        =      -  =     -        =     -  =     -        =     -    |
| *-   =             =     -   =     -       =      -  =     -        =     -    |
| -    =     -       =     -   =     -       =     -    =     -       =    -     |
| 0.0  =     -      =     -     =     -      =     -    =     -      =     -     |
| *     =     -     =     -     =     -     =      -    =      -     =           |
|       =     -    =      -           -     =     -      =     -    =      -     |
|        =    -    =     -       =     -    =     -      =     -    =     -      |
| *      =     -   =     -       =     -   =     -        =     -   =     -      |
|        =     -  =     -        =      -  =     -        =     -  =     -       |
| -0.5    =     - =     -         =     - =      -        =     -- =     -       |
|         =     -=      -          =    - =     -          =     -=     -        |
|                =     -           =     ==    -                 -=              |
| *        =    =-     -                                    =    =-     -        |
|           =   = -   -             =   = -    -             =  =  -   -         |
| *****************************************************************************  |
|0                  5                   10                   15                  |
+--------------------------------------------------------------------------------+
                                       x
y
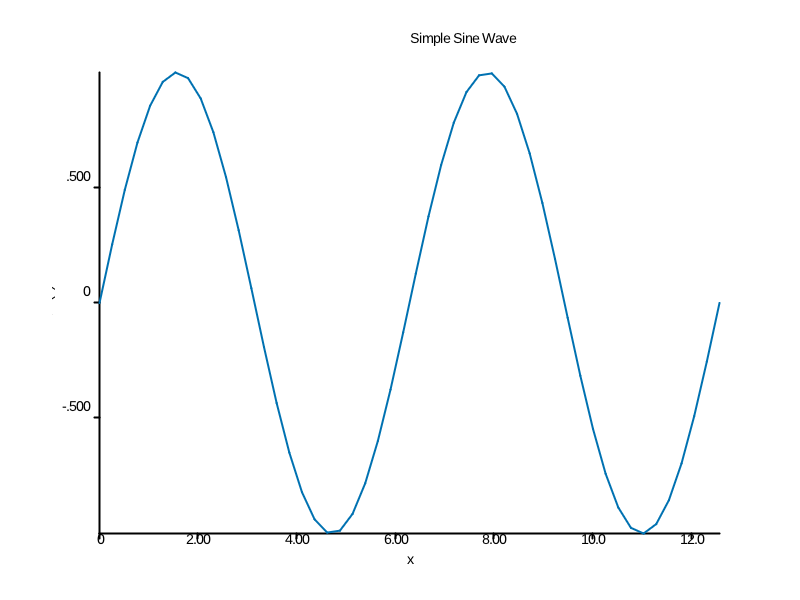
Simple Plot

ASCII output:
                                Simple Sine Wave
+--------------------------------------------------------------------------------+
|                                                                                |
| *        -                                                                     |
|        -- --                                 ------                            |
|       -     --                              -      -                           |
| *    -        -                             -       -                          |
| 0.5 -         -                            -         -                         |
|    -           -                          -           -                        |
| *  -            -                        -             -                       |
|   -                                     -                                      |
| *-               -                      -              -                       |
|                   -                                     -                      |
| 0.0               -                    -                 -                     |
| *                                     -                                      - |
|                    -                 -                    -                 -  |
|                     -                                     -                    |
| *                    -              -                      -               -   |
|                                     -                                     -    |
| -0.5                  -            -                        -            -     |
|                       -           -                          -           -     |
|                        -         -                            -         -      |
| *                       -        -                            -        -       |
|                          -      -                              --     -        |
| ** ** ** ** ** ** ** ** **-**-** ** ** ** ** ** ** ** ** ** ** **-**-** ** **  |
|0           2           4            6            8            10          12   |
+--------------------------------------------------------------------------------+
                                       x
sin(x)