Boxplot Demo
Boxplot Demo
Source: boxplot_demo.f90
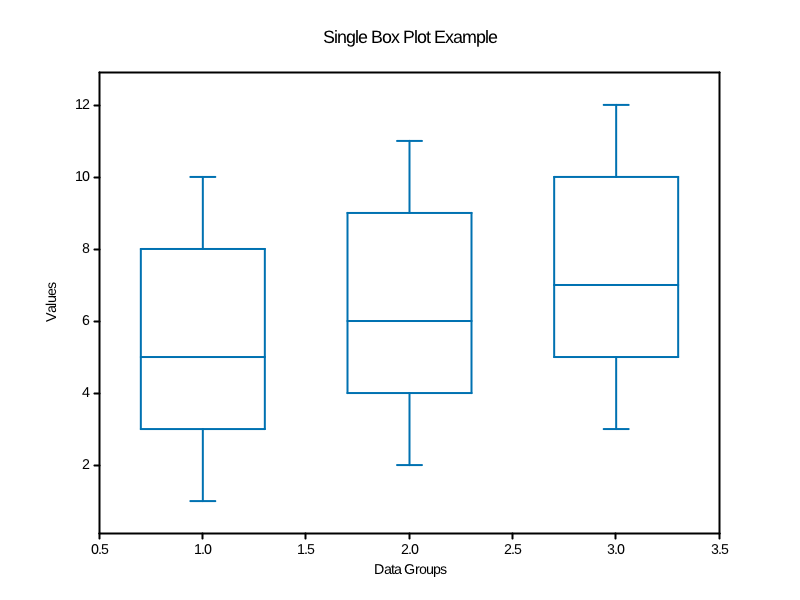
Demonstrates box-and-whisker plots for statistical data visualization.
boxplot_demo.f90- Source codeboxplot.png/pdf/txt- Example outputs
make example ARGS="boxplot_demo"
- Box-and-whisker plots: Statistical summary visualization
- Multiple datasets: Comparing distributions
- Outlier detection: Identifying data points outside normal range
- Custom styling: Colors and formatting options
The demo creates boxplots showing data distribution, quartiles, and outliers.
Files
boxplot_demo.f90- Source code- Generated media in
output/example/fortran/boxplot_demo/
Running
make example ARGS="boxplot_demo"
Output
Boxplot Demo
ASCII output:
                            Single Box Plot Example
+--------------------------------------------------------------------------------+
| 12                                                                             |
| |                                                                              |
| |                                                            #   #   #         |
| |   -#- Group A                                                  #             |
| 10  -#- Group B                   #   #   #                      #             |
| |   -#- Group C                       #                          #             |
| |      -   -   -                      #                  #    #  #  #    #     |
| |          -                          #                  #               #     |
| 8          -                  #    #  #  #    #          #               #     |
| |          -                  #               #          #               #     |
| |  -    -  -  -    -          #               #          #    #     #    #     |
| |  -               -          #               #          #               #     |
| 6  -               -          #    #     #    #          #               #     |
| |  -               -          #               #          #               #     |
| |  -    -     -    -          #               #          #    #  #  #    #     |
| |  -               -          #               #                  #             |
| 4  -               -          #    #  #  #    #                  #             |
| |  -               -                  #                          #             |
| |  -    -  -  -    -                  #                      #   #   #         |
| |          -                          #                                        |
| 2          -                      #   #   #                                    |
| |          -                                                                   |
| +----------+------------+-------------+-------------+------------+------------ |
|           1.0          1.5           2.0           2.5          3.0            |
+--------------------------------------------------------------------------------+
                                  Data Groups
Values